
Open source · MIT · v0.6
The debugging lab for your Android emulator and iOS simulator
EmuLabZip brings logs, network traffic, performance, memory, storage, crashes and accessibility of your Android emulators and iOS simulators into one fast, native app. Nothing to install on the device.
cargo install --git https://github.com/LuisPeixoto/EmuLabZip emulabzip-cli - Rust + Tauri
- macOS · Windows · Linux
- Android + iOS
- MCP for AI assistants
Works with
- Android Emulator
- iOS Simulator
- ADB
- simctl
- Perfetto
- Instruments
- macOS
- Windows
- Linux
Everything in one place
One lab for everything your emulator knows
Stop switching between Logcat, Instruments, Android Studio profilers and a proxy. EmuLabZip reads the public interfaces of the platforms, so it keeps working when Xcode and Android Studio update.
-
Live logs
logcat and the iOS unified log in one table that stays smooth at thousands of lines per second, with level, tag, text and regex filters.
-
Performance
CPU, memory, frame rate, janky frames and battery for the app you pick, charted as it runs.
-
Memory
Snapshots with a diff by category, plus heap dumps (.hprof) and memory graphs (.memgraph) one click away.
-
Storage
Browse an app's sandbox and open SQLite databases, preferences, property lists, JSON and images in place.
-
Network proxy
Decrypt HTTPS from your app, read headers and bodies, follow WebSockets and HTTP/3, export HAR, import packet captures.
-
Mocks and breakpoints
Answer a request yourself, slow it down, block it, or stop it and edit the request or the response.
-
Traces and flame graphs
Perfetto system traces with SQL, simpleperf and Instruments recordings, shown as flame graphs.
-
Crashes and ANRs
Crashes, native crashes and ANRs with stacks, the facts the device wrote down and hints for symbolication.
-
Device controls
Change location, dark mode, the status bar, battery, permissions, notifications and links, each with a way back.
-
Layout and accessibility
See every view of a screen and audit labels, touch targets and contrast, on Android and the iOS Simulator.
-
Sessions and CI
Record a whole run into one file, and let emulabzip ci record around your test command in GitHub Actions.
-
Compare devices
Two emulators side by side: both screens, CPU and memory charts and every fact that differs.
See it working
Real screens from the real app
Every image below is a screenshot of EmuLabZip debugging an Android emulator or an iOS simulator.
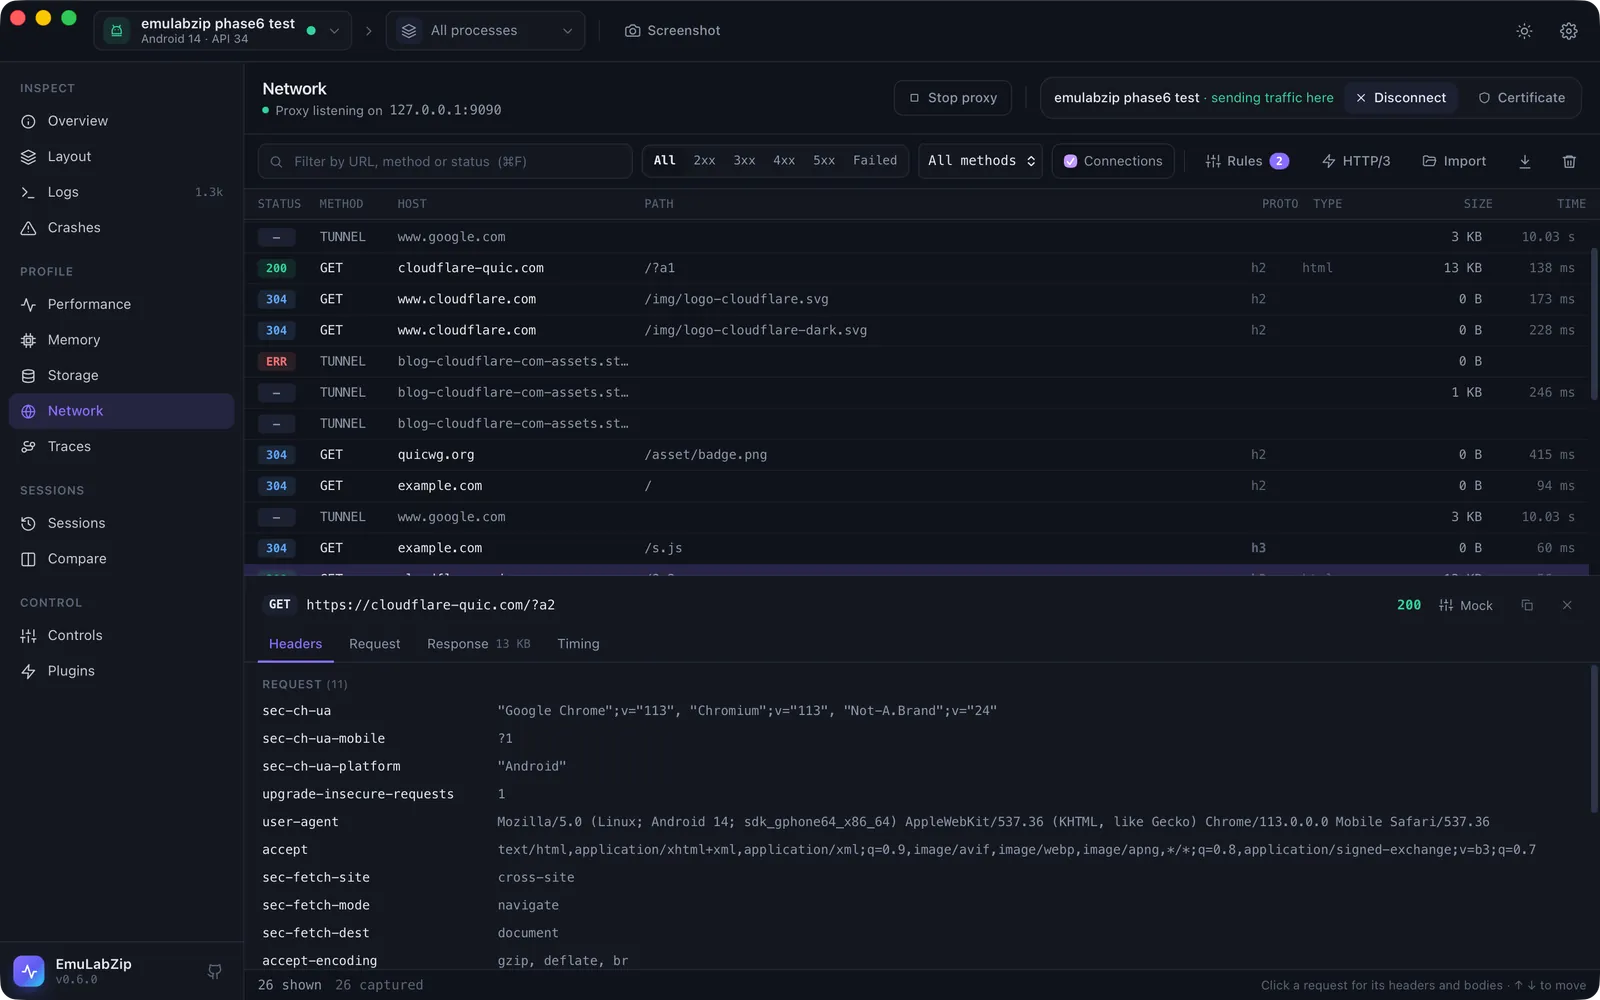
Decrypted requests, with the protocol used
Every request of your app with headers, decoded bodies and timing, and which HTTP version each one used.
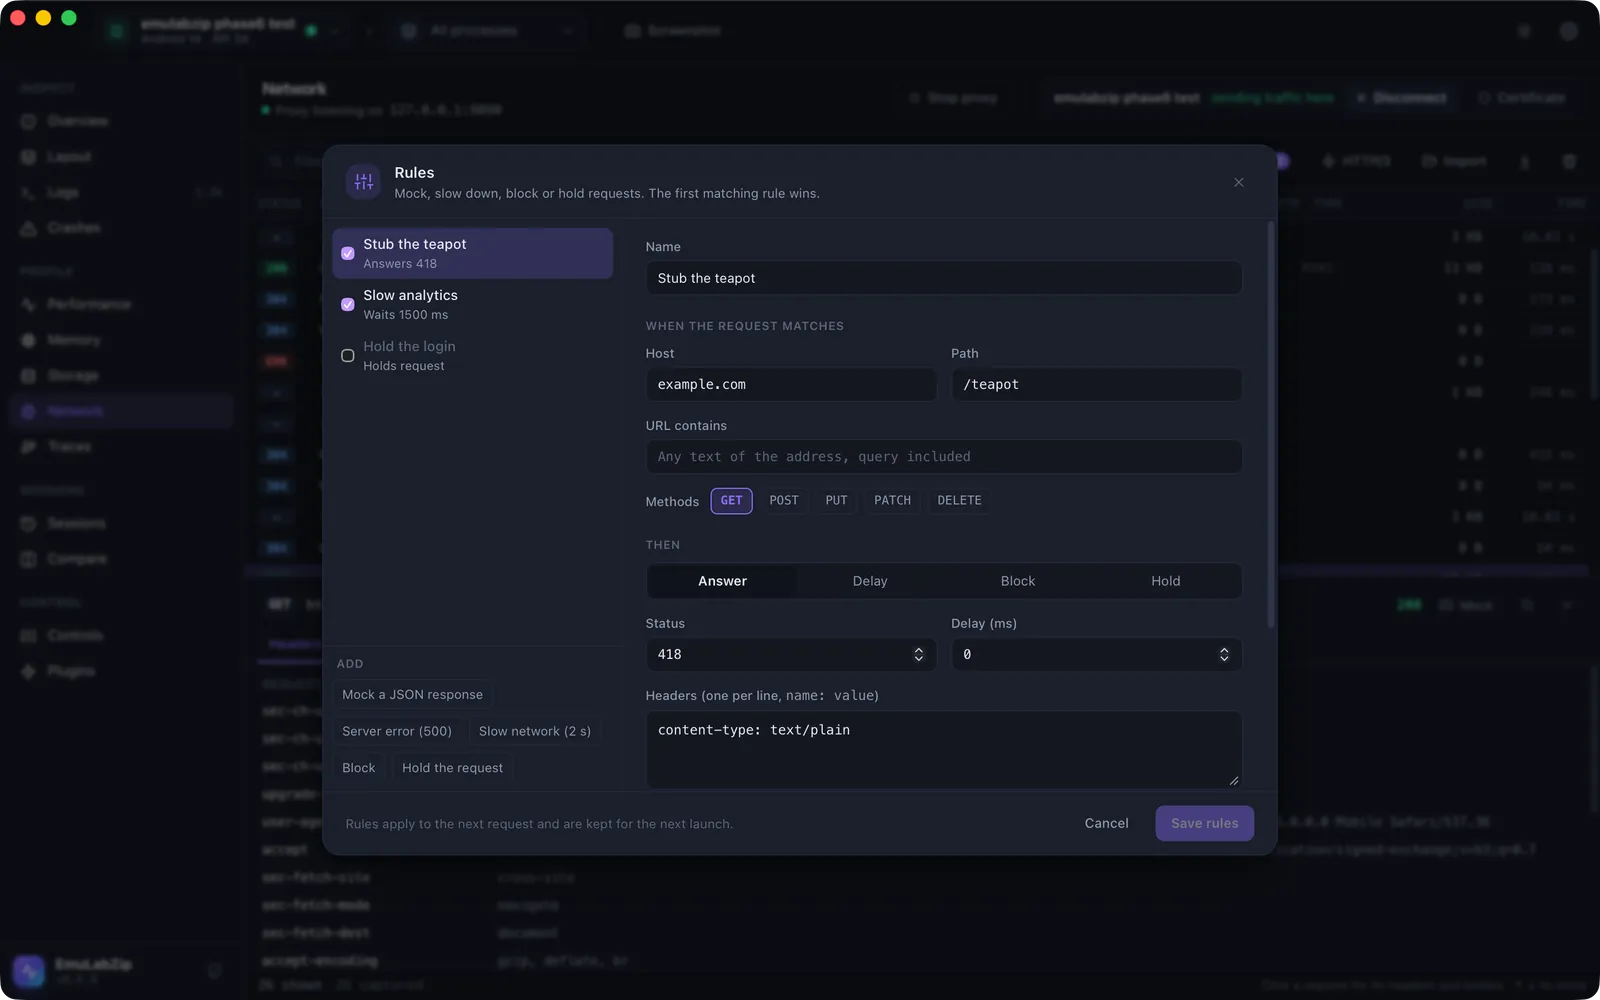
Change what your app gets back
Mock a response, add a delay, block a request or hold it at a breakpoint, without touching the server.
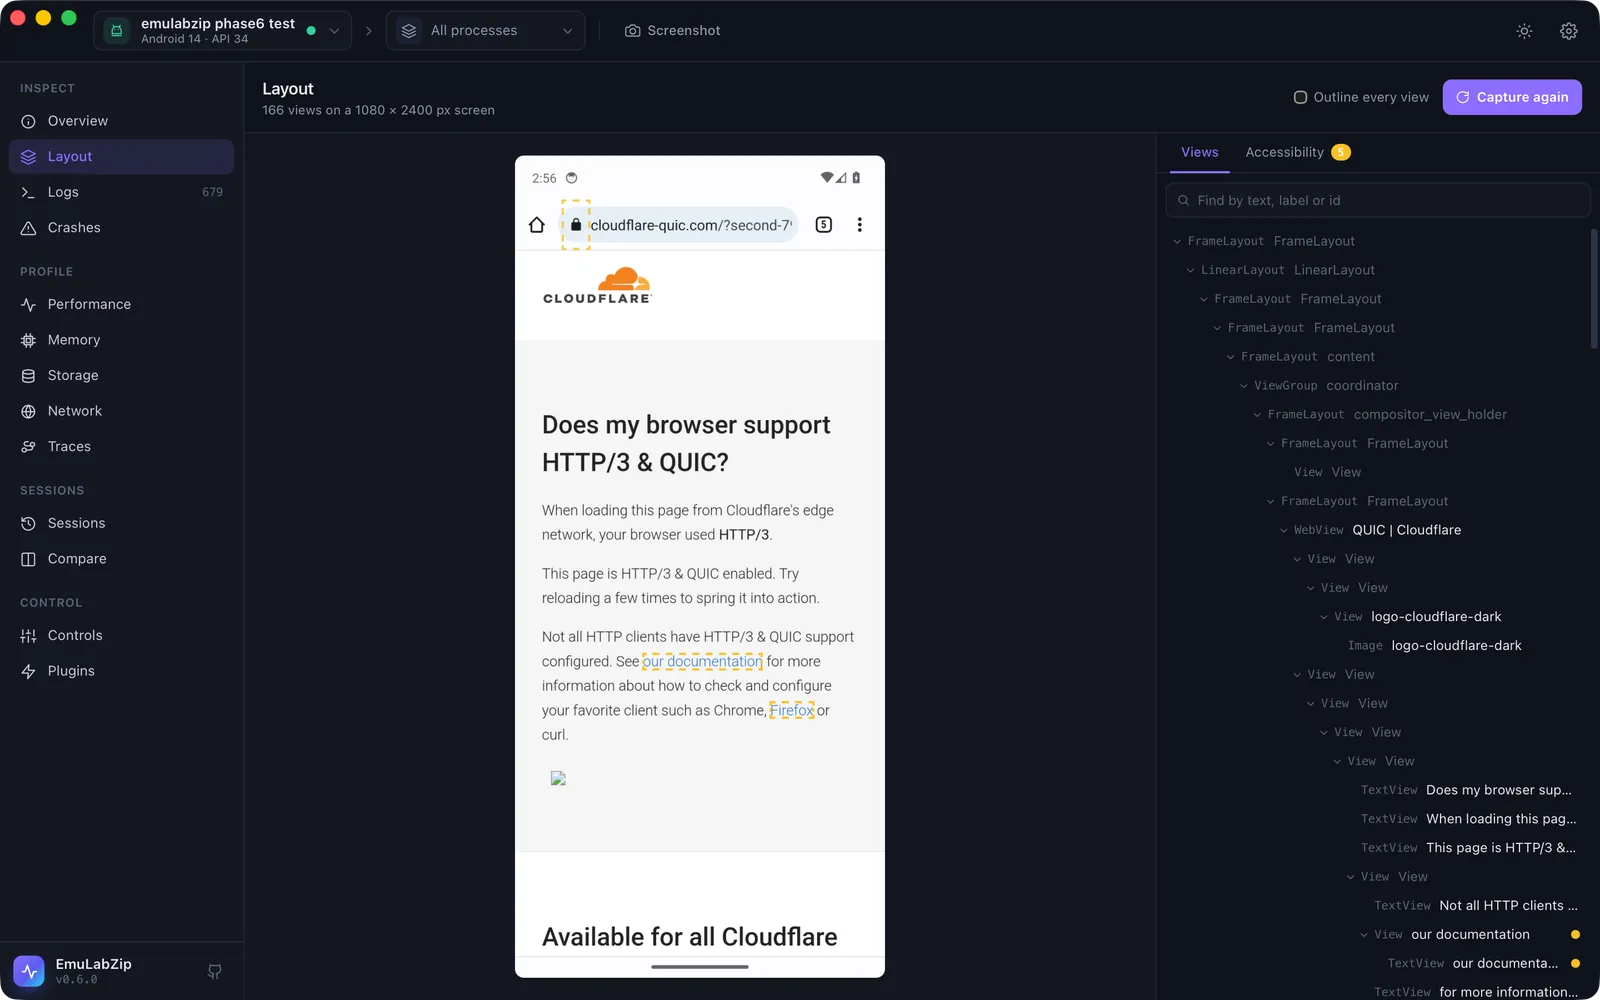
Every view on the screen
A screenshot with the tree of views beside it: names, sizes, ids and what can be tapped.
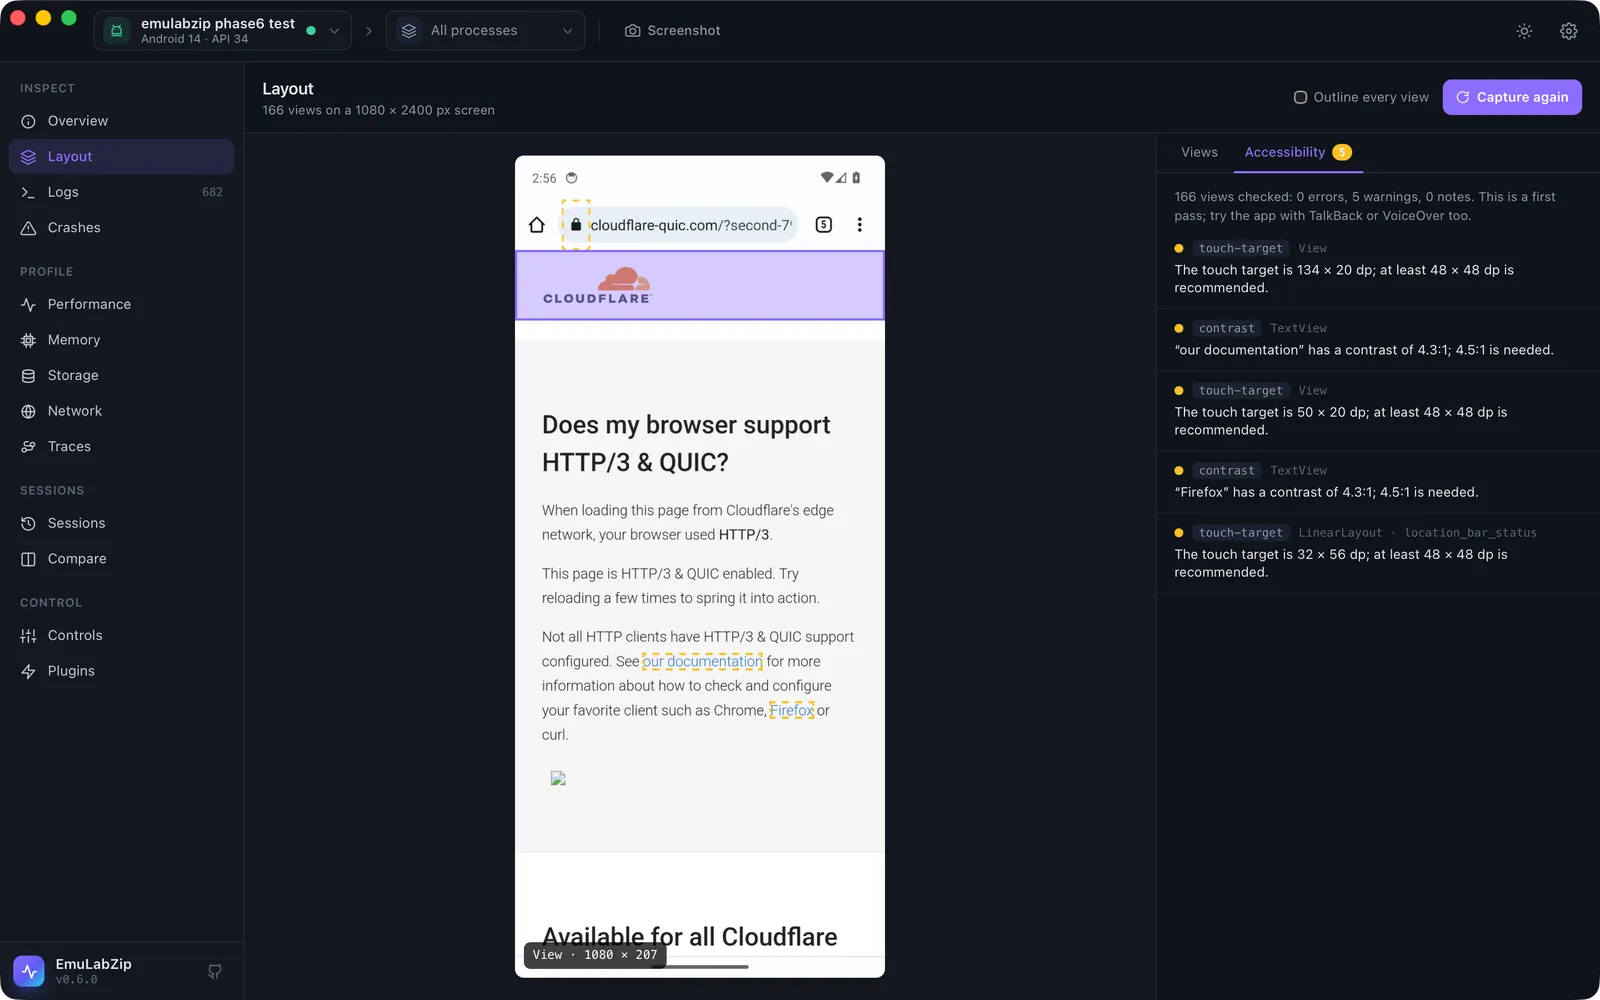
Find what a screen reader would trip over
Missing labels, small touch targets and low-contrast text, each with the view, the WCAG criterion and a fix.
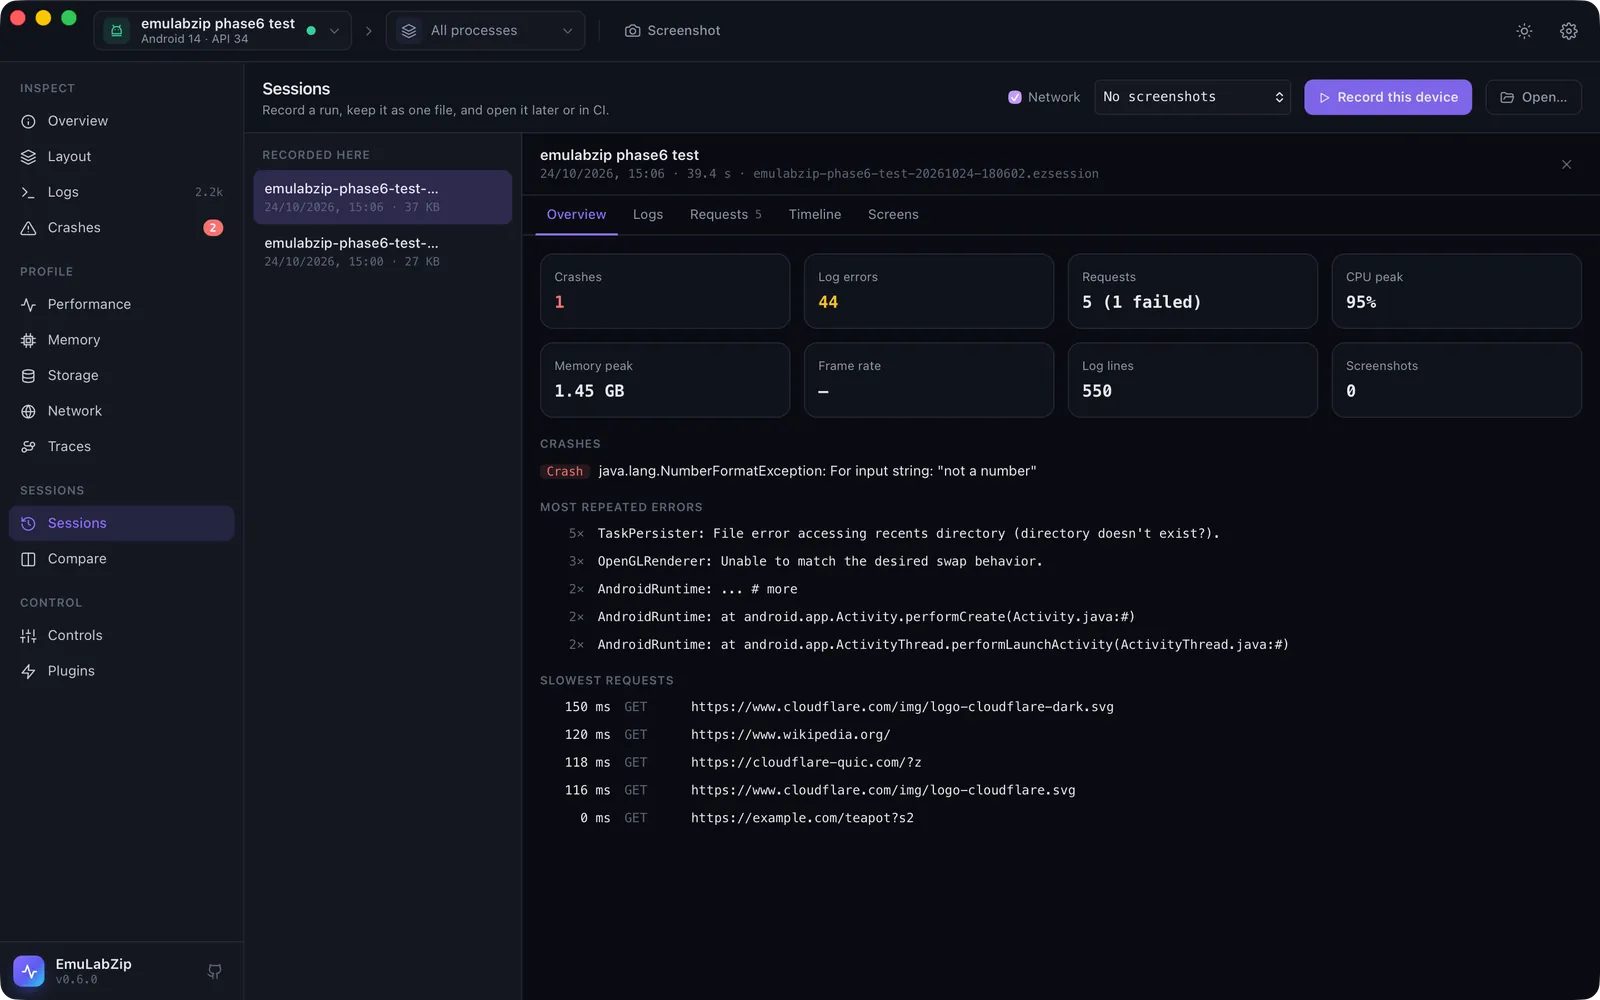
A whole run in one file
Errors, crashes, requests, CPU and memory of a run, kept as a file you can open later or collect from CI.
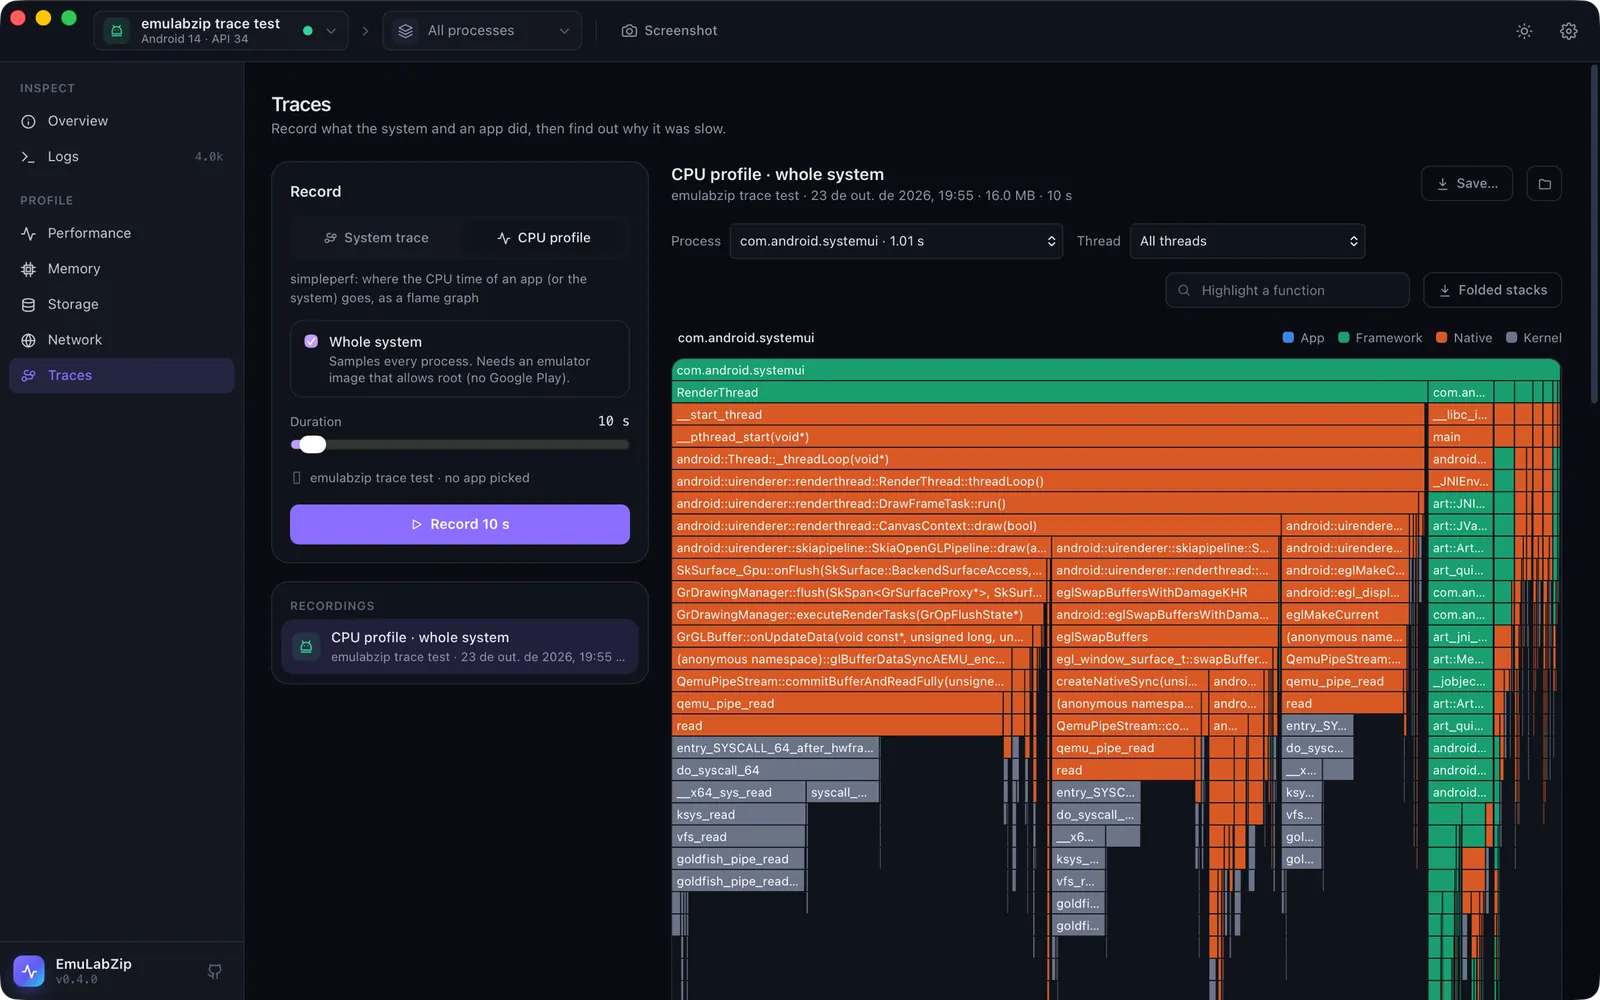
Where the CPU time goes
A whole-system CPU profile as a flame graph, coloured by whose code it is.
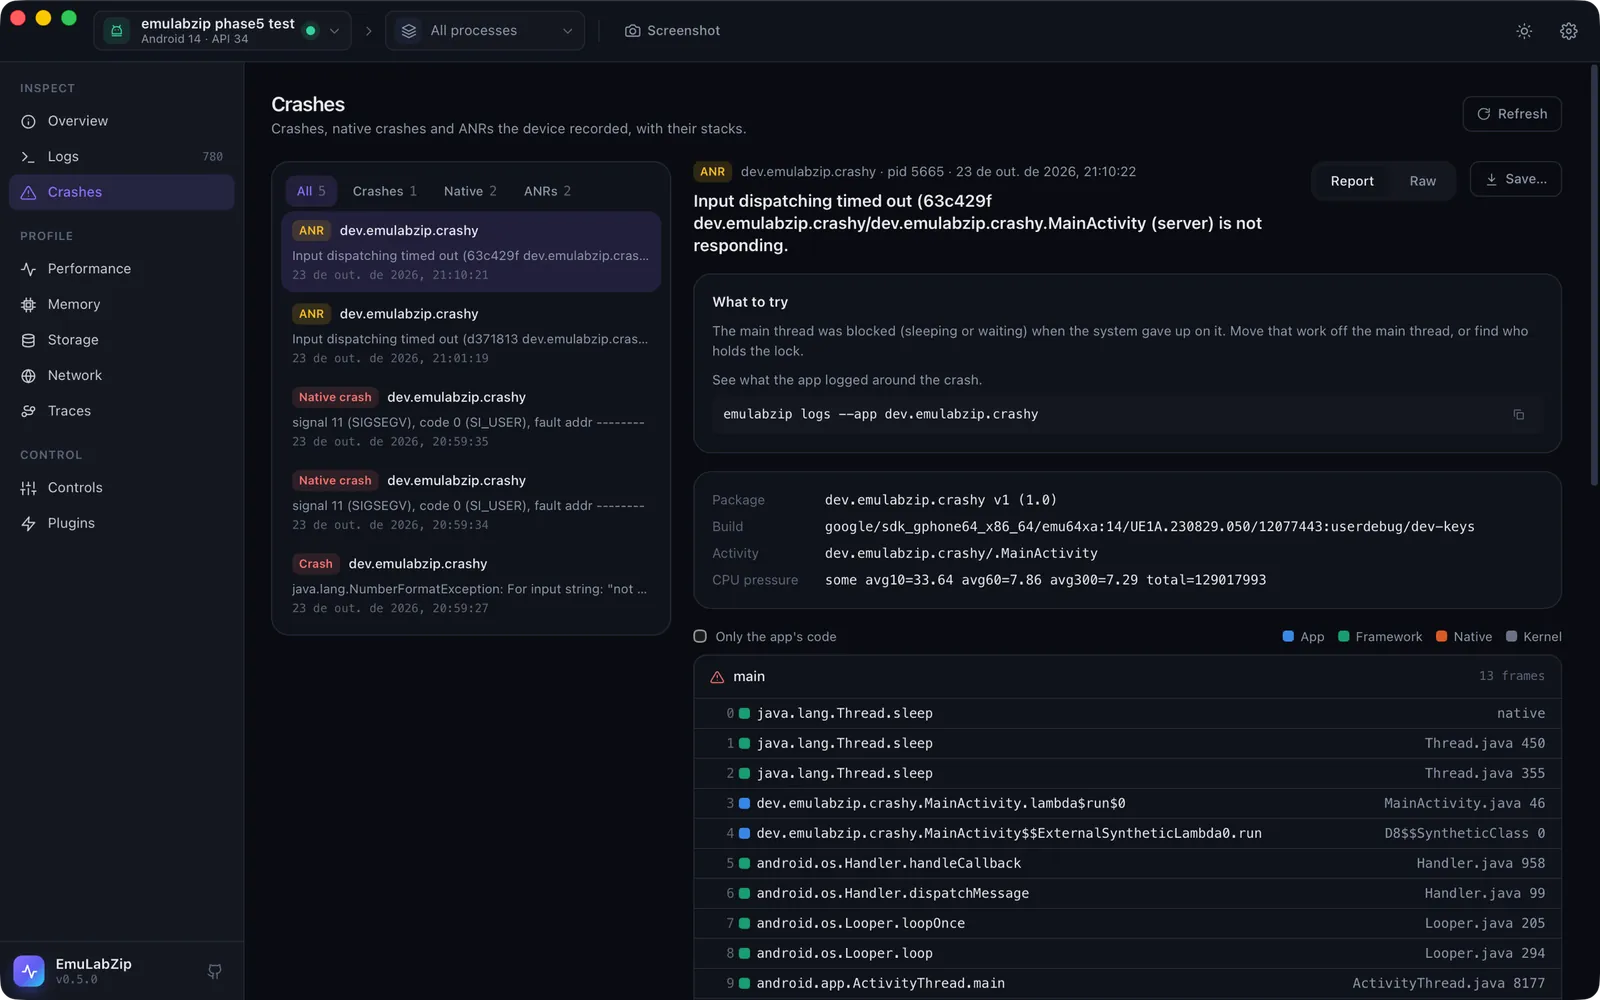
Crashes, with what to try next
Stacks grouped by thread, the device's own details and hints for symbolication.
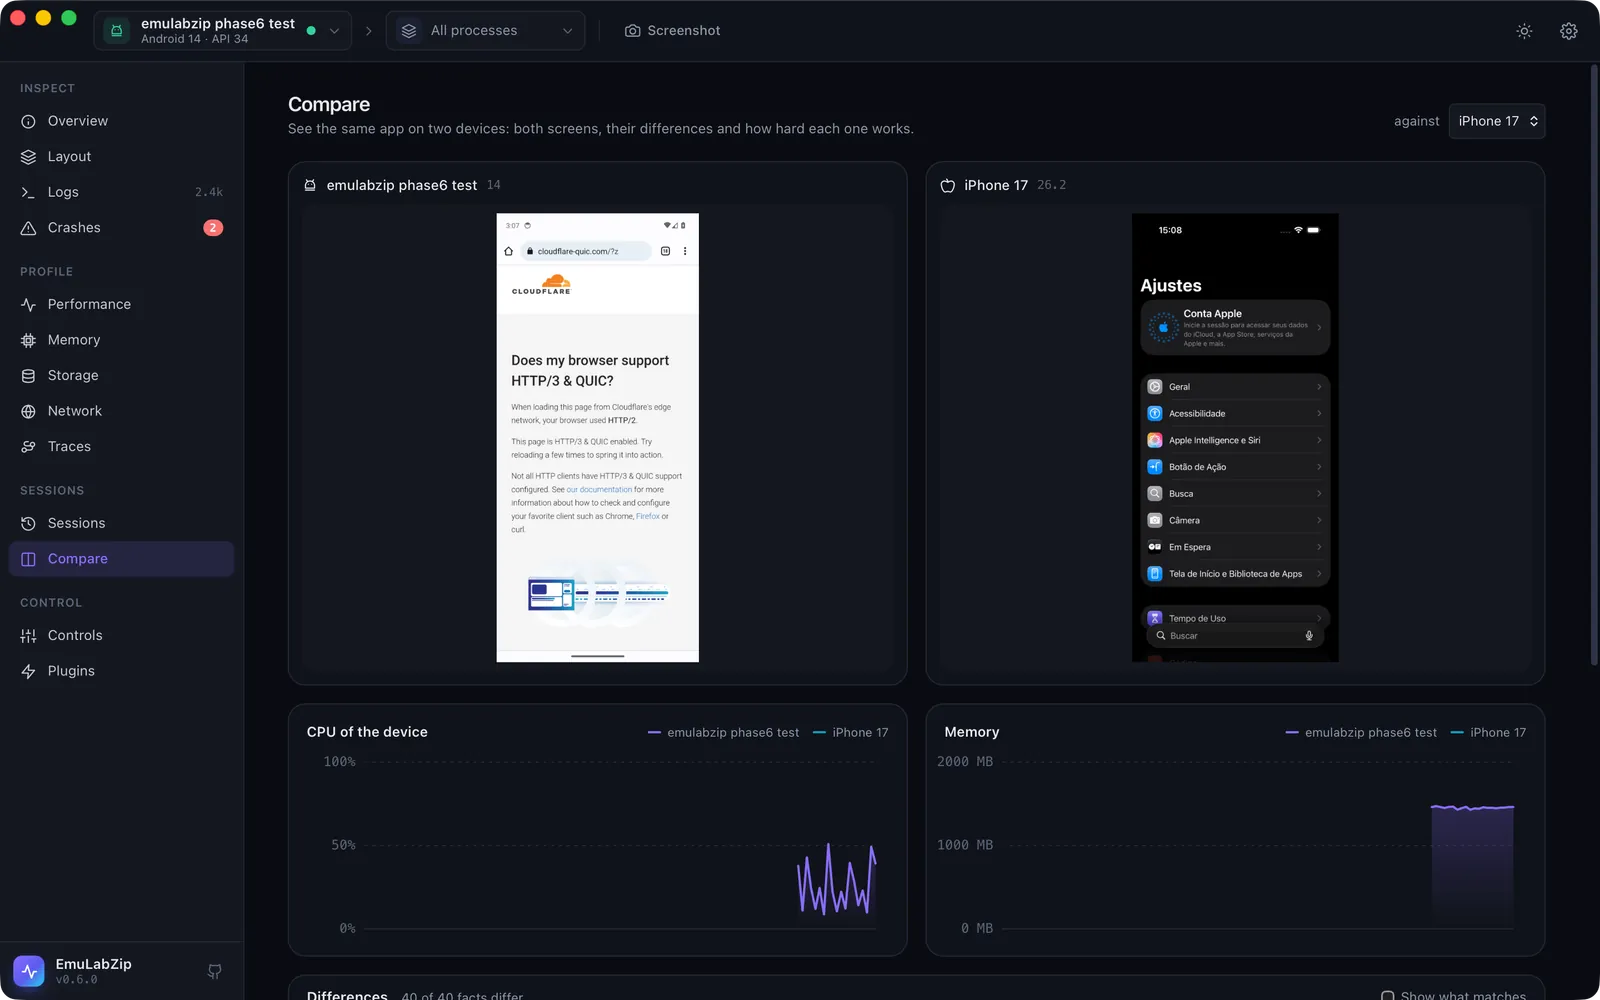
Two devices side by side
An Android emulator next to an iPhone simulator, with charts and a table of differences.
For scripts and CI
A command line that prints tables for people and JSON for scripts
The same engine as the app, in one small binary. Run it on your laptop or in your CI pipeline.
- Mock or block requests from a JSON file with net --rules
- Fail a build when the screen regresses with a11y --fail-on
- Record logs, requests, crashes and screenshots around your tests with ci
- Use it from macOS, Windows and Linux, on Android emulators and iOS simulators
Built for AI assistants
Let your AI assistant look at the emulator
EmuLabZip includes an MCP server. Connect Claude, or any MCP client, and it can read logs and crashes, take screenshots, audit a screen and control the device.
- 29 tools: logs, crashes, traces, layout, sessions and device controls
- Speaks on standard input and output only, with no network port
- Actions are validated, and plugins run only after you enable them
Why EmuLabZip
Built to be trusted with your devices
A small, fast and honest tool, made in the open.
Open source, MIT
Read the code, run it, change it. No account, no telemetry, no connections of its own.
Public interfaces only
ADB, simctl, Perfetto and the accessibility tree. No private frameworks and no agent installed on the device.
Android and iOS together
One tool and one habit for both platforms, instead of one tool for each.
Native and light
A Rust core with a Tauri interface: a small download, a fast start and low memory use.
Undoes what it changes
Proxy settings and device overrides are put back when you stop, also after an error.
Made to be scripted
Every feature is in the command line and in the MCP server, with JSON output.
Roadmap
Where EmuLabZip is going
Six phases are done. The next four lead to a stable 1.0.
- v0.1 – v0.3
Observe
Devices, logs, performance, memory, storage and the network proxy.
- v0.4
Tracing
Perfetto, simpleperf and Instruments, with flame graphs and SQL.
- v0.5
Crashes and automation
Crashes, device controls, an MCP server and plugins.
- v0.6
Power tools
Mocks, breakpoints, WebSockets, HTTP/3, layout, accessibility, sessions and CI.
- v0.7
Performance and quality
App start time, energy, leak finder and performance budgets in CI.
- v0.8
Inside frameworks
Flutter, React Native, Compose and SwiftUI; gRPC and GraphQL.
- v0.9
Devices and platforms
Physical iPhones, Android over Wi-Fi, Wear OS, TV and Apple platforms.
- v1.0
Team and ecosystem
Shareable reports, rule libraries, a VS Code extension and a stable promise.
Questions
Frequently asked questions
What is EmuLabZip?
EmuLabZip is a free, open-source desktop app and command line tool that lets you inspect, monitor and debug apps running in Android emulators and iOS simulators: logs, network traffic, performance, memory, storage, crashes, layout and accessibility.
Is EmuLabZip free?
Yes. EmuLabZip is open source under the MIT license. There is no account, no paid plan and no telemetry.
Which operating systems does it run on?
macOS, Windows and Linux. iOS simulators need a Mac with Xcode, because Apple only provides them there. Android emulators work on all three systems.
Do I need to install anything on the emulator?
No. EmuLabZip uses the public tools of each platform (ADB and simctl), so nothing is installed on the device or inside your app.
Can it see my app's HTTPS traffic?
Yes. The built-in proxy decrypts HTTPS once the emulator trusts the EmuLabZip certificate, which the app installs for you. Apps that pin their certificate are passed through unchanged.
Does it work with AI assistants?
Yes. EmuLabZip includes an MCP server, so assistants such as Claude can read logs and crashes, take screenshots, audit accessibility and control the device.
Can I use it in CI?
Yes. The emulabzip ci command records a session around your test command, keeps its exit code, and can fail the run when the app crashes or the screen has accessibility problems.
Does it support physical devices?
Not yet. Android emulators and iOS simulators are supported today. Physical iPhones and Android over Wi-Fi are planned for v0.9.
Start debugging your emulators in a minute
Download the app, boot an emulator or a simulator, and it shows up on its own.