
Traces
The Traces tool records what the system and an app did over a few seconds, then helps you find out why it was slow. It brings together three official tools and keeps their output in one library:
| Recording | Device | Tool | What you get in EmuLabZip |
|---|---|---|---|
| System trace | Android 9 and newer | Perfetto | A summary (CPU, frames, memory, busiest slices), a SQL console, and a button to open the full timeline in the Perfetto UI |
| CPU profile | Android 8 and newer | simpleperf | A flame graph with hot functions and folded-stack export |
| Instruments | iOS Simulator | xcrun xctrace | A flame graph for Time Profiler recordings, and a button to open the .trace in Instruments |
Quick start#
- Open Traces (⌘7) and pick your device. Pick an app in the toolbar if you want to focus on one.
- Choose what to record, set the duration (1 to 300 seconds) and press Record. Stop ends it early and keeps what was recorded so far.
- The recording opens by itself. Every recording is kept in the Recordings list until you delete it.
From a terminal:
emulabzip trace record --preset frames --duration 15 -o frames.pftrace
emulabzip trace summary frames.pftrace
emulabzip trace query frames.pftrace "select name, count(*) n from slice group by name order by n desc limit 10"
emulabzip trace cpu --app com.example.app --duration 10 --folded stacks.txt
System traces (Perfetto)#
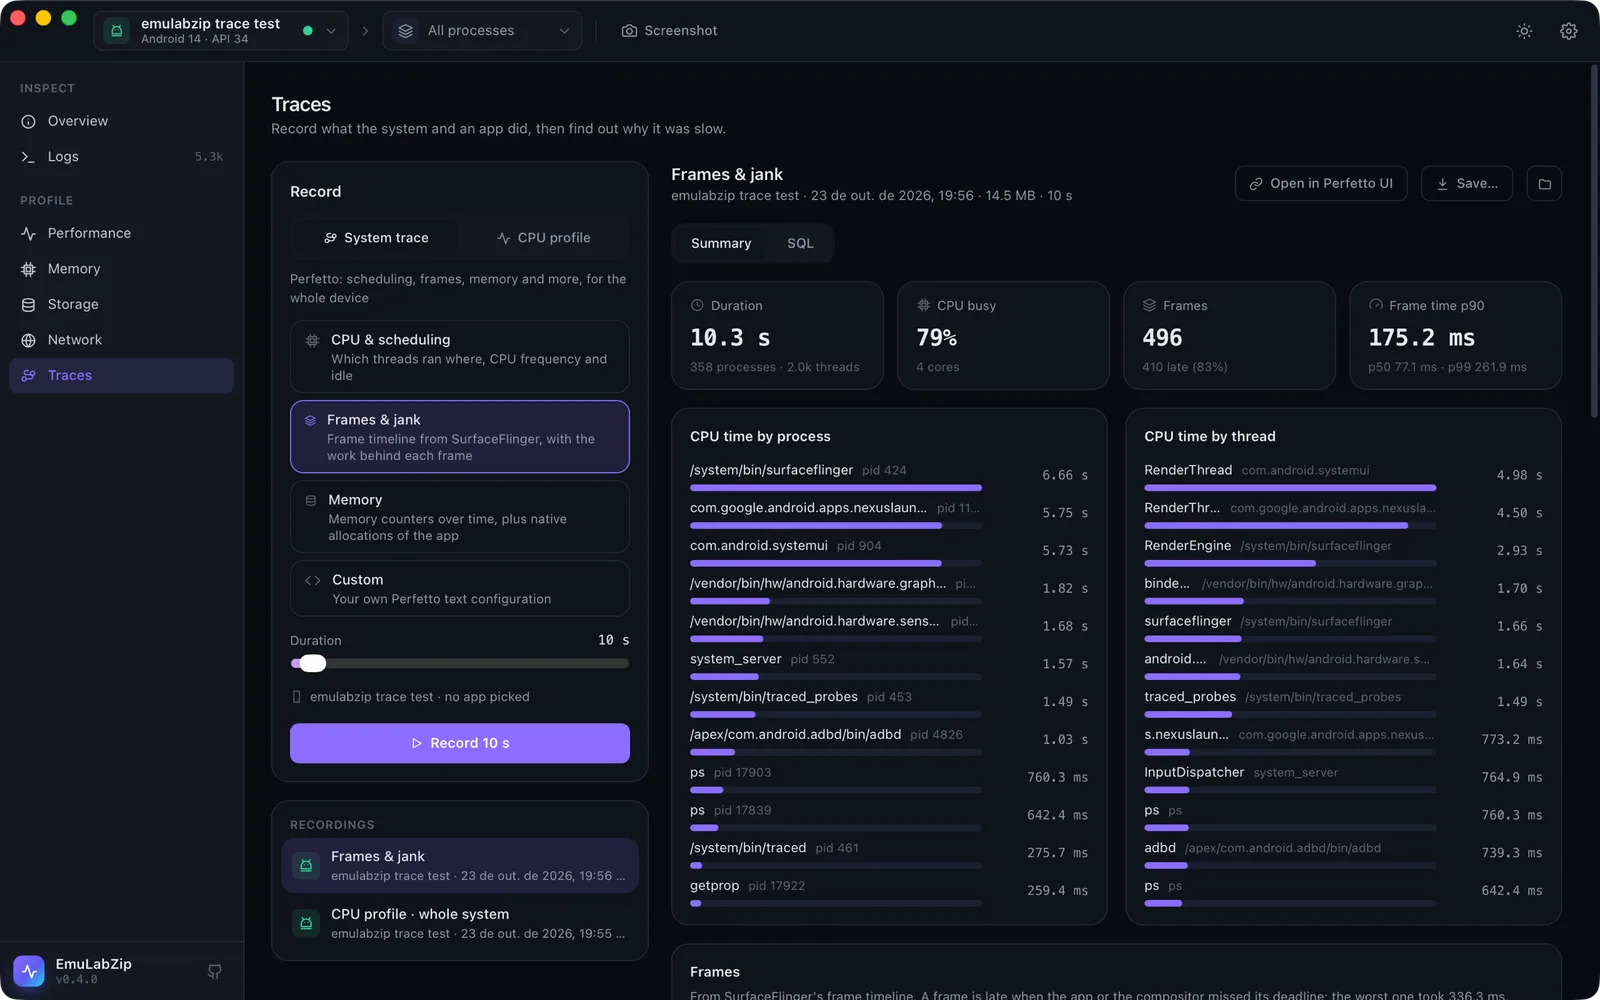
Four presets cover the usual questions. They are ordinary Perfetto text configurations, so Custom accepts your own.
| Preset | Records | Use it to answer |
|---|---|---|
| CPU & scheduling | Scheduler switches and wakeups, CPU frequency and idle states, the process list | Which threads used the CPU, and was it available? |
| Frames & jank | SurfaceFlinger's frame timeline, plus the view, graphics, input and binder slices around it | Which frames were late, and what was running when they were? |
| Memory | Process memory (mem.rss) and system memory counters every 250 ms, plus native allocations (heapprofd) when an app is picked | Where does memory grow? |
| Custom | Whatever your configuration says | Anything else |
The Summary tab shows:
- the trace length, how busy the CPU was, the number of frames and the frame time at the 50th, 90th and 99th percentile;
- CPU time by process and by thread;
- for frames: the kinds of jank (as SurfaceFlinger names them), and per layer how many frames were late. A frame counts as late when the app or the compositor missed its deadline; Prediction Error and Buffer Stuffing alone do not;
- memory: the lowest and highest system counters and the peak resident memory per process;
- the slices with the most time in total.
A section is left out when the trace has no data for it. A memory trace has no scheduling, and a CPU trace has no
frames. Use the SQL tab for everything else: it runs PerfettoSQL
(⌘/Ctrl + Enter) with tables such as slice, sched, thread, process and
counter, and shows up to 5,000 rows.
The trace processor#
Reading a Perfetto trace needs Google's trace_processor_shell. EmuLabZip does not bundle it. The first time you open
a Perfetto trace it explains the download and asks first:
- it comes from the official Perfetto release on GitHub (version pinned in the source, 12 to 81 MB depending on the platform);
- the file is checked against a SHA-256 that is pinned in the source, and is discarded if it does not match;
- it is kept in
tools/inside EmuLabZip's data folder, and started on127.0.0.1only, on a free port, when you open a trace. It is stopped when you open another trace or quit.
Open in the Perfetto UI#
Open in Perfetto UI serves the file once from 127.0.0.1 with the headers ui.perfetto.dev
needs, then opens your browser. The page loads the trace from your own computer: the file is never uploaded. The server
only answers for that one file, and stops after it has been fetched or after two minutes.
CPU profiles (simpleperf)#
simpleperf samples the CPU with call stacks. EmuLabZip runs it on the device, converts its report on the device and
pulls the result, so no NDK is needed on your computer.
- An app: the app must be running, and debuggable or profileable. Otherwise simpleperf refuses and EmuLabZip says so. It does not wait for an app that is not running.
- Whole system: samples every process. It needs
adb root, so use an emulator image without Google Play.
The flame graph is an icicle: the outermost call on top, width in proportion to CPU time. Click a frame to zoom in, use the breadcrumb to zoom out, type to highlight a function, and choose another process or thread above it. Colours tell whose code a frame is:
| Colour | Meaning |
|---|---|
| Blue | The app's own code: installed apps, their libraries and JIT-compiled app methods |
| Green | Platform managed code: the Android framework, ART, *.jar, *.odex, *.oat |
| Orange | Native libraries (.so) |
| Grey | The kernel |
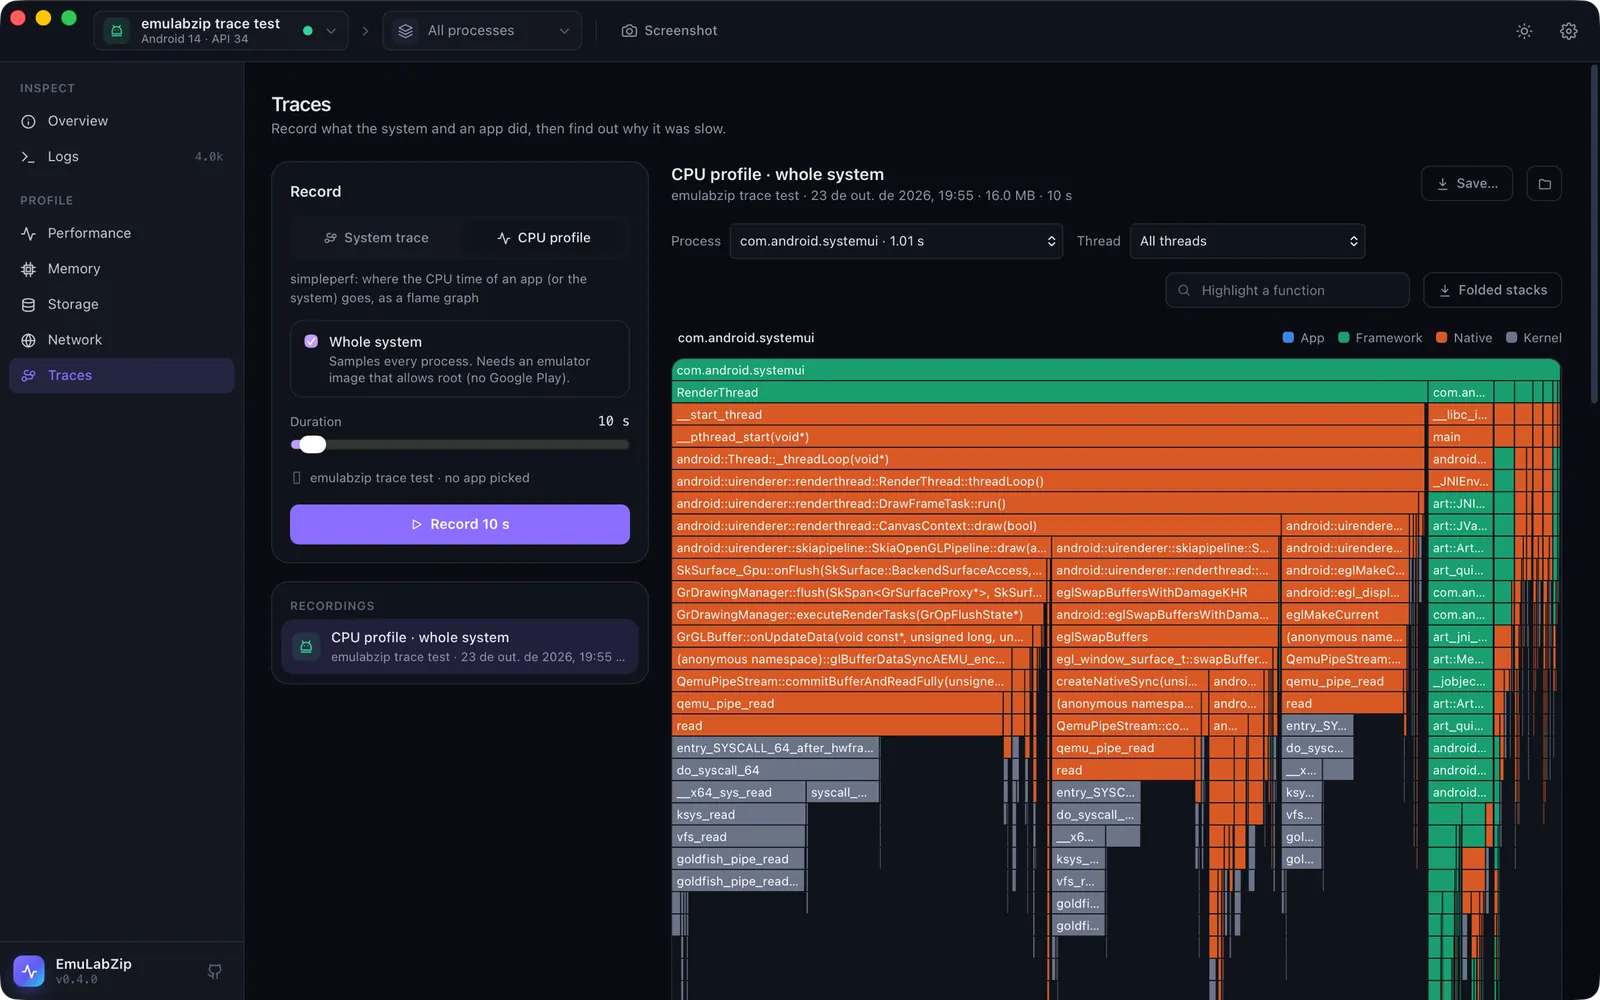
Under the graph, Hot functions lists where time was spent in a function itself rather than in what it called.
Folded stacks saves the call tree for flamegraph.pl and speedscope. The raw perf.data is kept next to the
recording; Show in folder reveals it.
Instruments (iOS Simulator)#
EmuLabZip runs xcrun xctrace record for any template that xctrace list templates reports, attached to the app you
picked (or all processes). The result is a .trace document: Open in Instruments opens it. For Time Profiler
and CPU Profiler, EmuLabZip also exports the samples (xctrace export) and draws the same flame graph.
Requirements:
- Xcode, with
xcrun xctraceavailable. - Developer Mode on the Mac. Without it,
xctracewaits for an approval nobody can give. EmuLabZip checksDevToolsSecurity -statusfirst and tells you what to do: runsudo DevToolsSecurity -enablein a terminal. - For one app, it must be running in the simulator.
The Time Profiler export reader follows the shape xctrace documents (rows with a thread, a weight and a stack, with
repeated elements written once and referenced by id). It is covered by tests on a hand-written export; recordings from
a Mac with Developer Mode were not available while it was written. If a recording opens without a flame graph, the
.trace is still intact and opens in Instruments. Please open an issue with the Xcode version.
Where recordings live#
Each recording is a folder in traces/ inside EmuLabZip's data folder (EMULABZIP_HOME moves it):
traces/20261023-184501-3f2a/
    meta.json          what was recorded, where and when
    trace.pftrace      or profile.pb (+ perf.data), or recording.trace (+ time-profile.xml)
emulabzip trace list prints them. Deleting one in the app removes its folder. Nothing is written to a device that
is not removed again: configurations, raw recordings and reports are deleted from the device when a recording ends,
whether it worked, failed or was stopped.
Limits#
- At most 300 seconds per recording, and 1 GB per Perfetto trace.
- Perfetto needs Android 9 (API 28) or newer. On Android 9 and 10, EmuLabZip switches
persist.traced.enableon, as the system image ships it off.